
Election map guide
How to Make an Animated US Election Map for the 2028 Presidential Election
Create a state-by-state animated US election map with Electoral College totals, margin colors, labels, custom styling, and MP4 or PNG export.
If you were looking for an answer to the question “What software do YouTubers use for election maps?”, you're in the right place.
This is exactly where you can generate an animated US election map for your content using GenerateAnimatedMap.com — an election map generator for content creators.
This is a short guide on how to visualize state-by-state election predictions or results using different colors for each party.
If you would like to watch a video guide, here you are. This guide on YouTube:
1. Open the Generator
Go to the Generator page:
2. Select the USA map
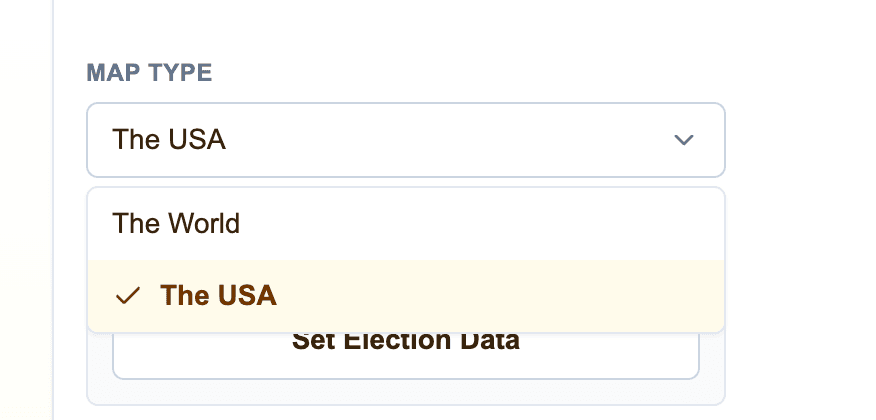
Select “The USA” from the Map Type dropdown. This will load the US map into your current project.
You will see the default map in the preview area.
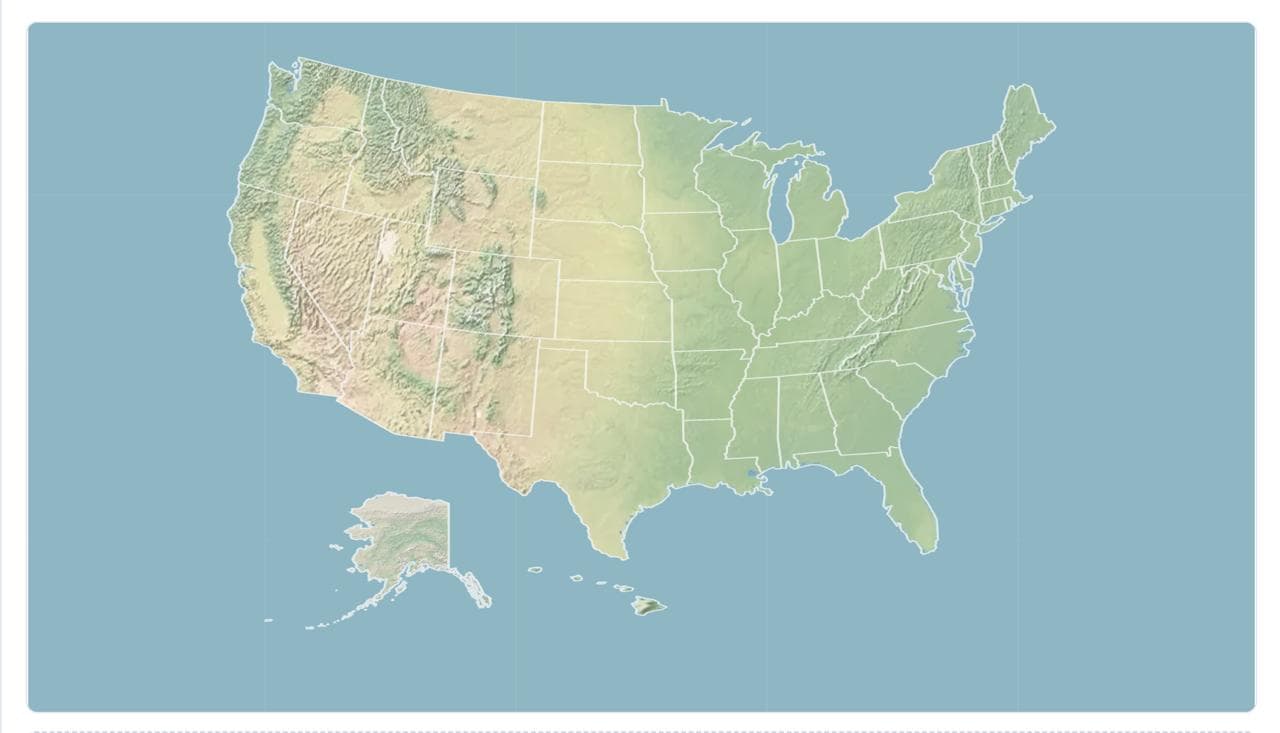
We'll customize the map later. For now, let's finish setting up the election data for the two major parties: Democrats and Republicans.
3. Enable Election Mode
Click “Enable Election Mode”
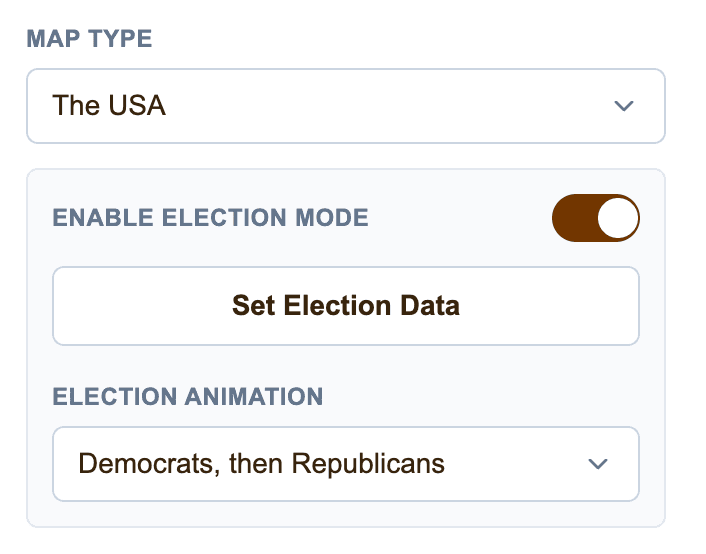
This is a specific map creation mode in our project designed for US elections.
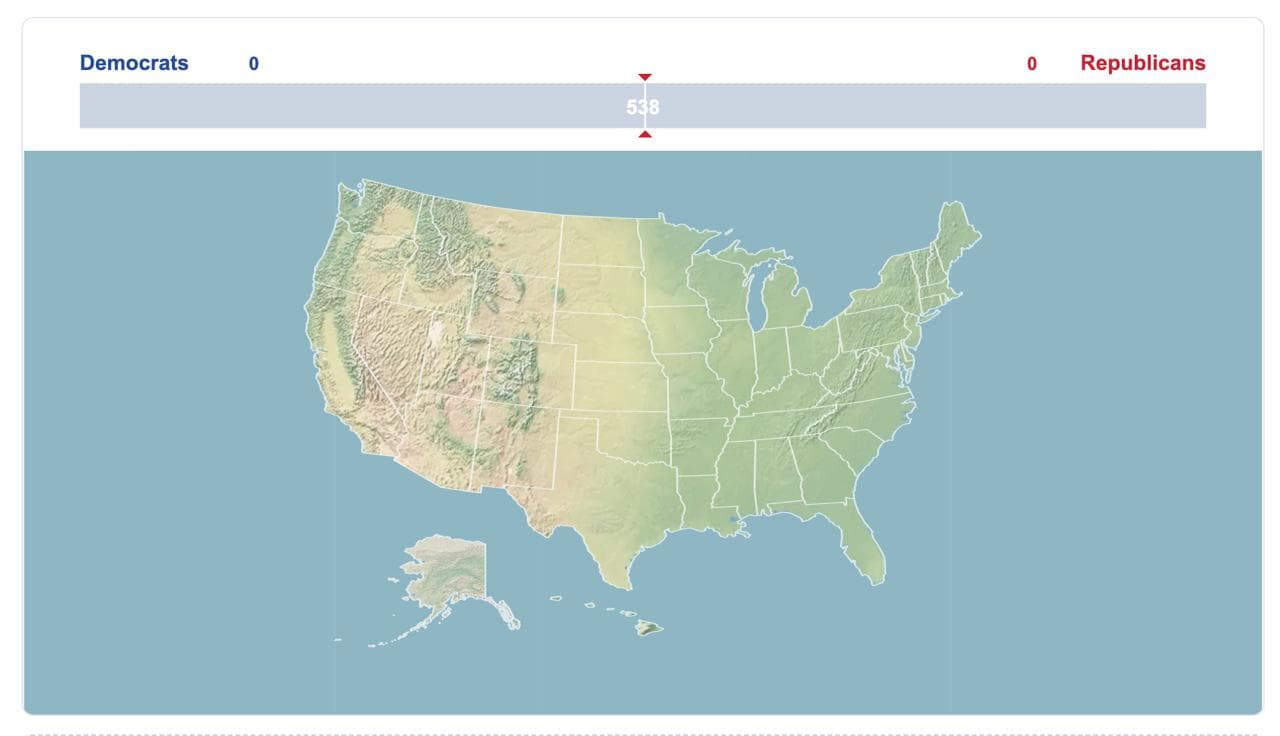
It adds the vote breakdown bar at the top of the map and allows you to set election data for each state. You can hide this bar later if you don't need it in your video.
4. Set your election data
Now click “Set Election Data.”
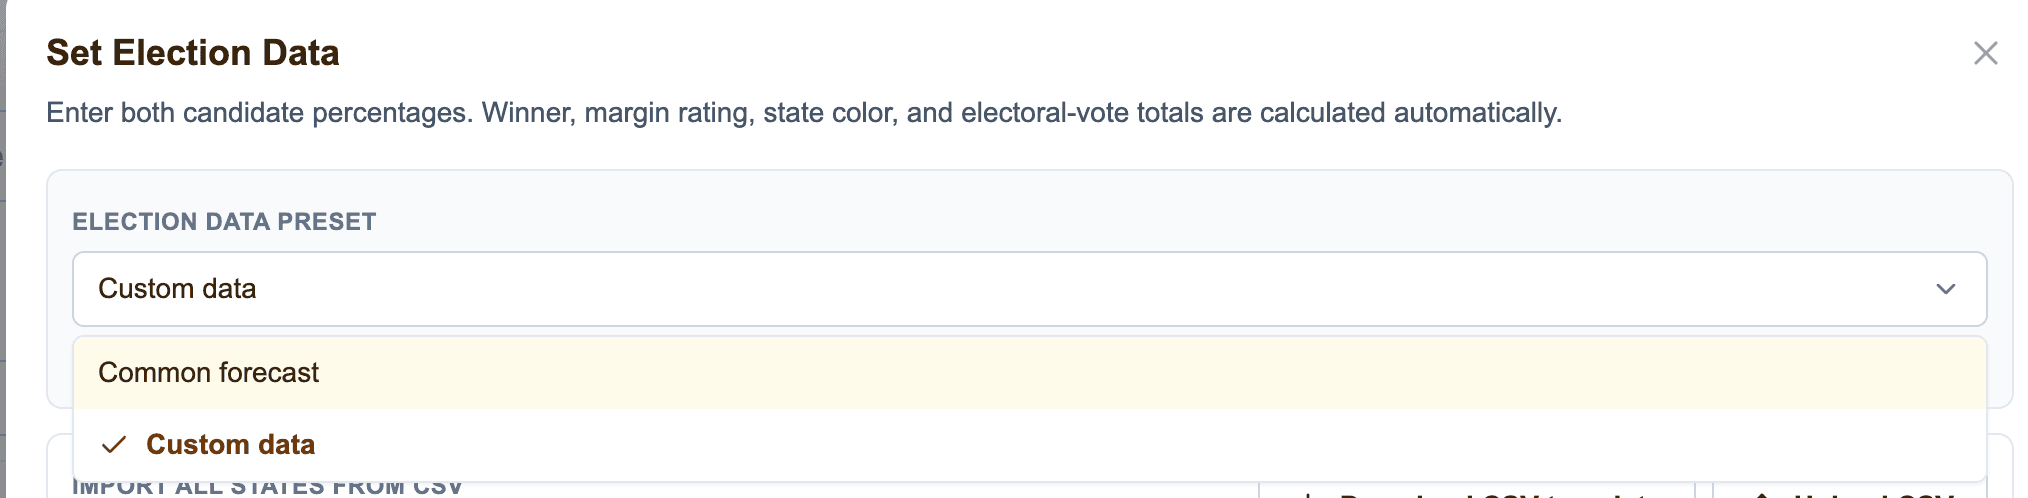
Here you have three ways to populate the data:
- Enter the data manually.
Add the percentage for each party for every state in the popup.
- Use a preset.
You can select one of the existing presets and then customize it. For example, there is a “Common Forecast” preset.
- Upload your own CSV file.
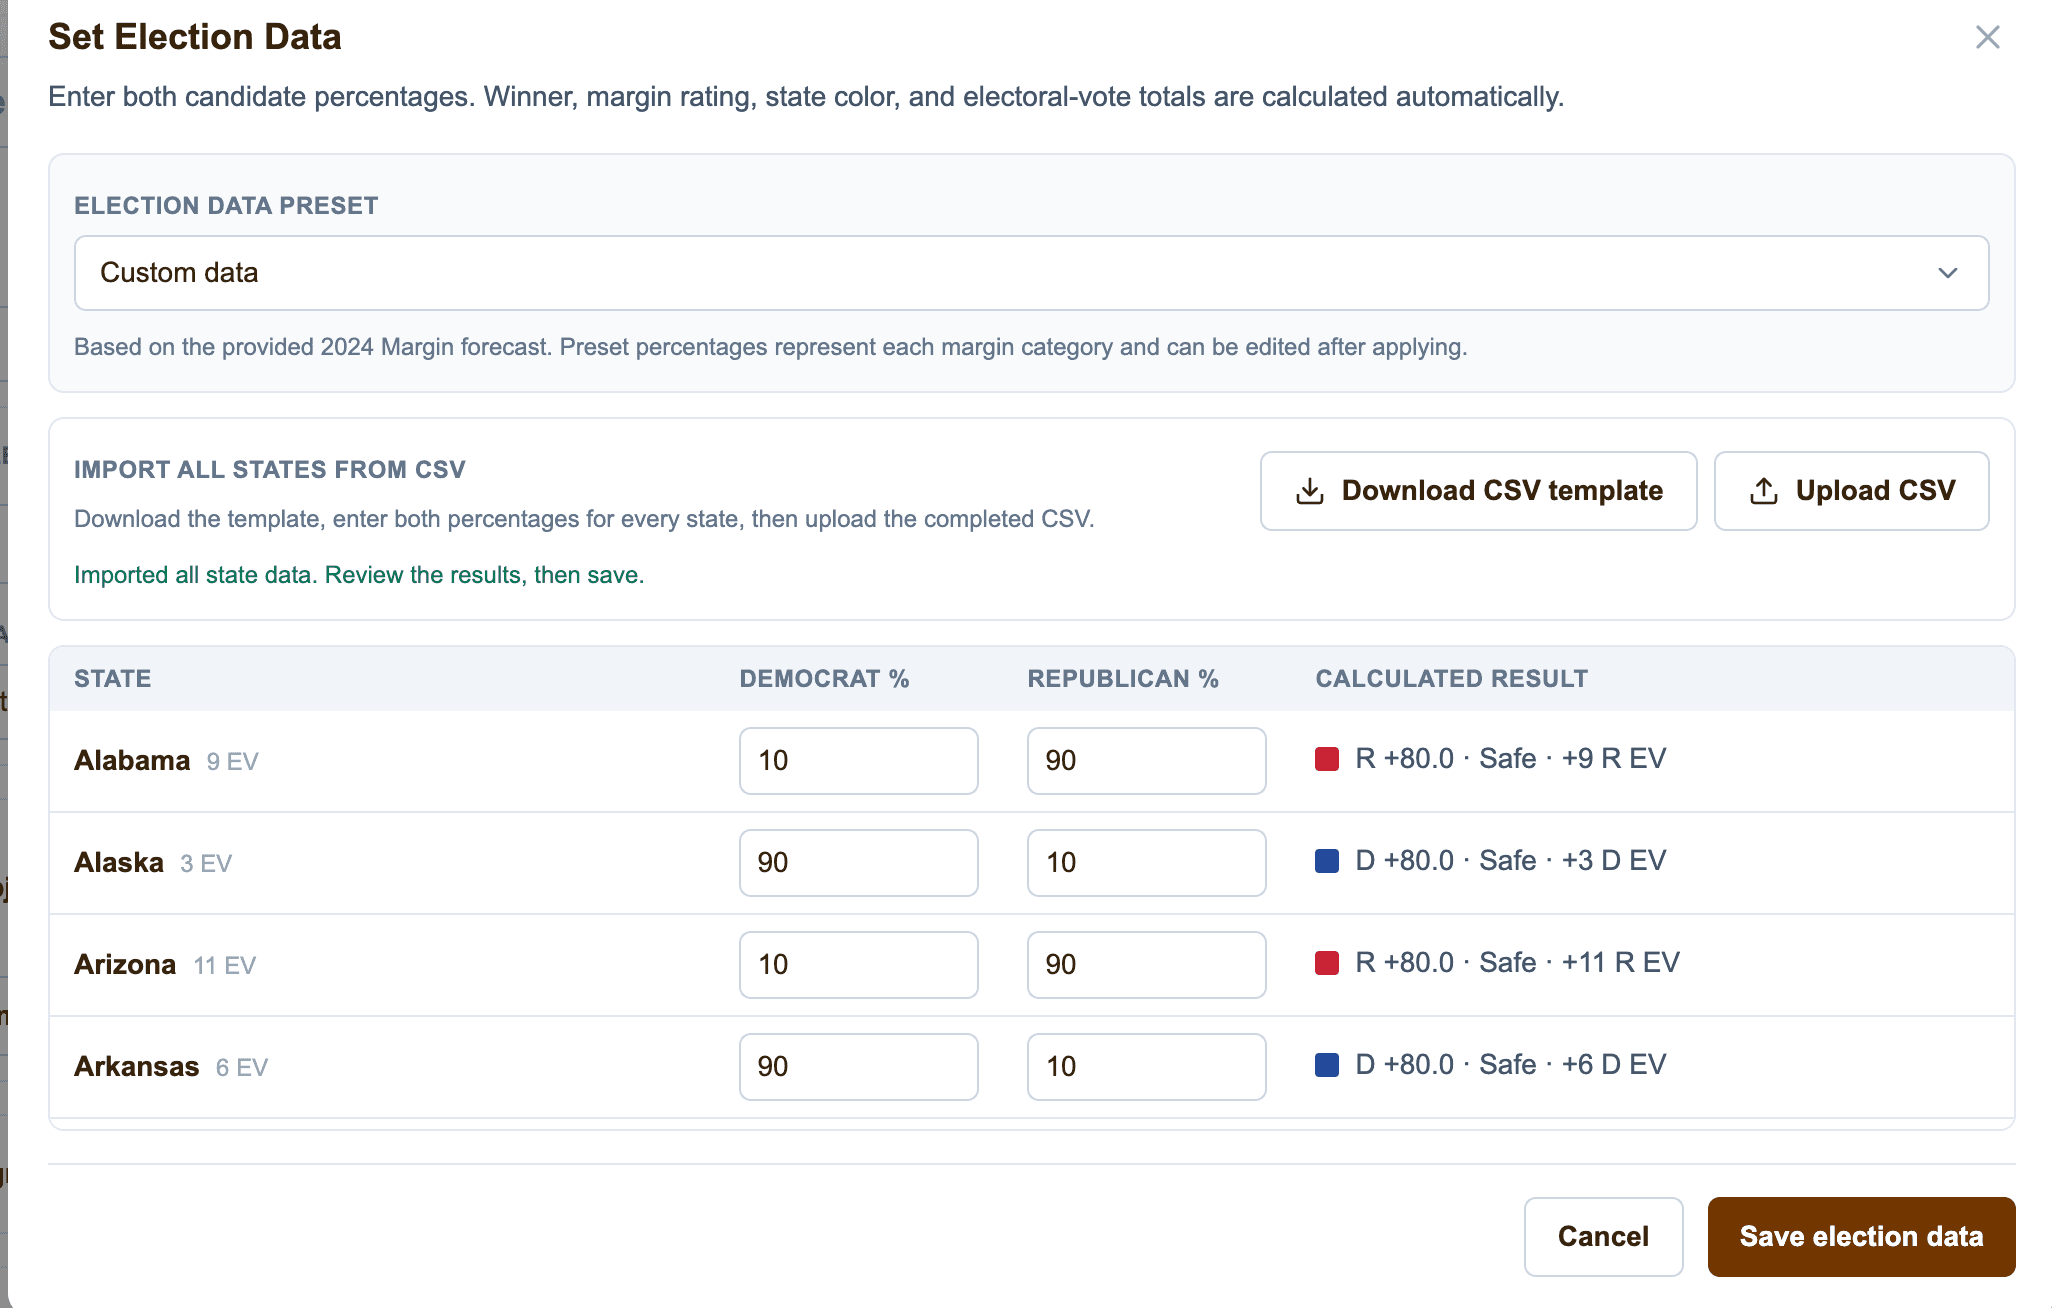
You can upload a custom CSV file containing your election data with three columns:
state,democrat,republican
First, you can download our CSV template, fill it with your data, and upload it back to the popup.
If you already have your election data in Excel or Google Sheets, simply export it as a CSV file and make sure the column names match the format required by our service.
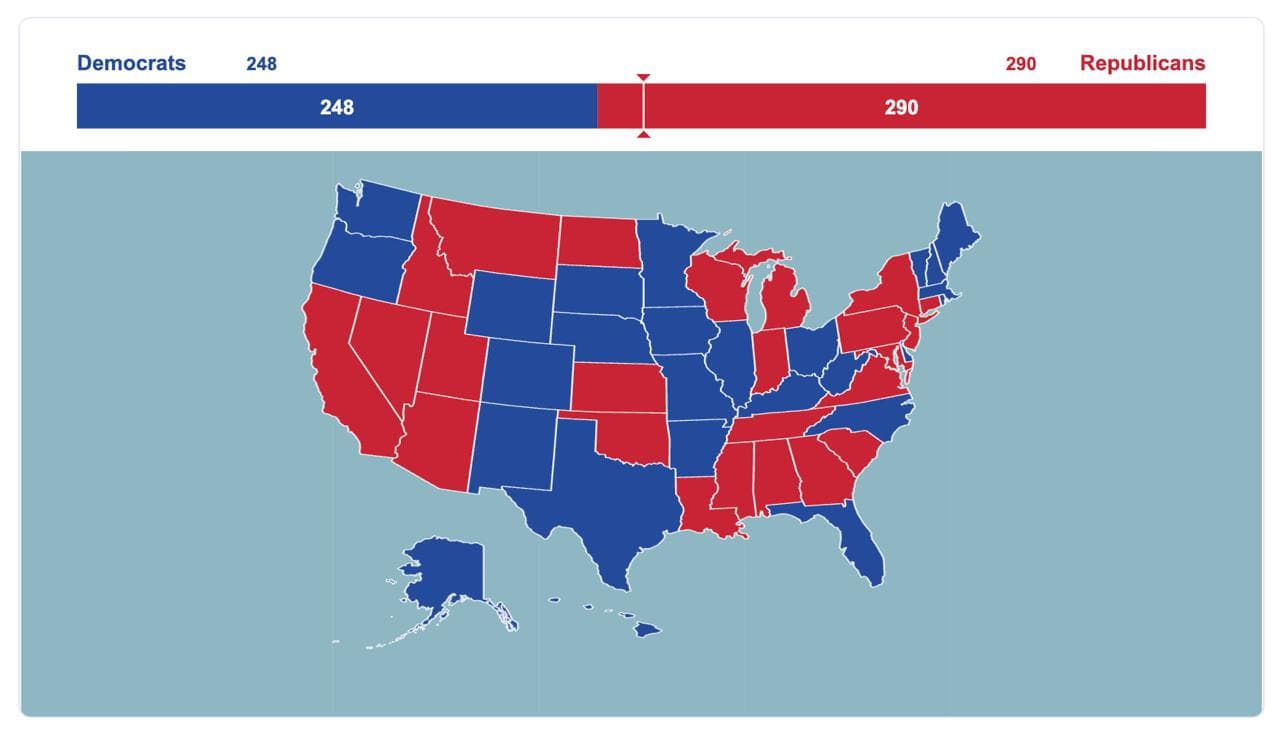
5. Select your election map animation
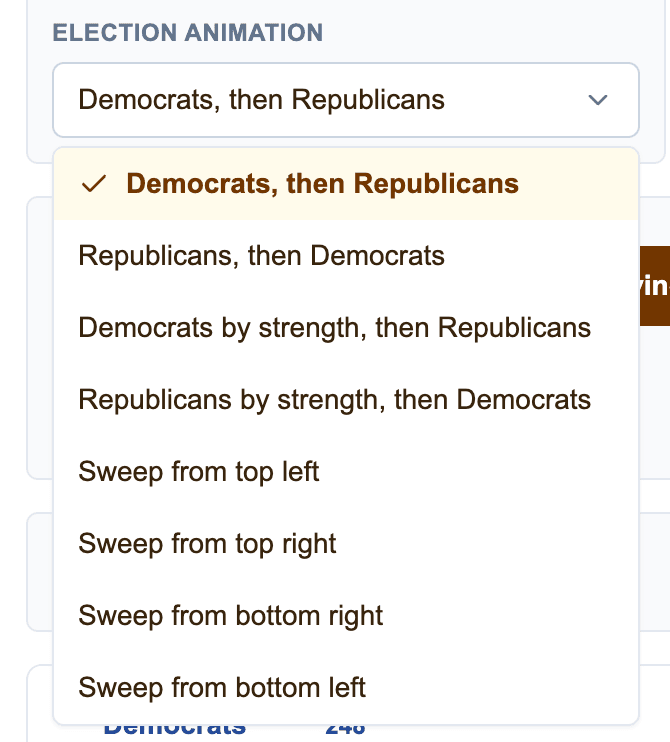
Now, or later, select your favorite animation type for coloring the states.
There are several animation types available, and we're constantly testing and adding new ones.
6. Preview the animation
You can see how each animation looks directly in the preview section.
Just click the Play button and check the result.

7. Set the video duration and aspect ratio
You can also set the duration of your animated election map and choose the appropriate aspect ratio.
For example:
- 1:1 — Instagram or LinkedIn posts
- 16:9 — YouTube videos
- 9:16 — YouTube Shorts, Instagram Reels, and TikTok videos
This makes it easy to create the same US election map animation for different social media platforms.
8. Customize the style of your US election map
Now let's customize your map.
You can change the appearance of the map using the Style dropdown below the map preview.

Available styles include:
- Clean Light
- Dark Documentary
- Satellite-like Dark
- Vintage Travel
- Military Tactical
- Minimal News
- Physical Relief — the default style
We're constantly adding and testing new styles.
If you want to create another type of animated map that isn't related to elections, you can even upload your own background image.
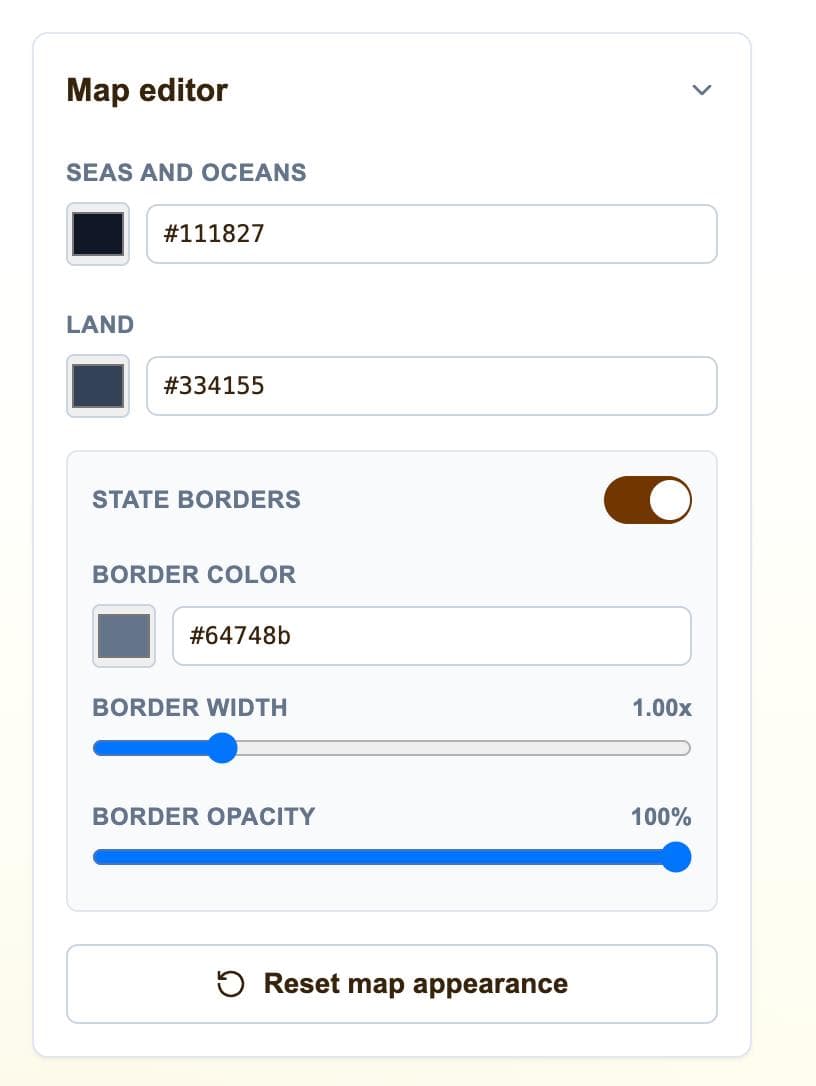
9. Customize the map itself
In the Map Editor panel in the right sidebar, you can customize:
- Sea and ocean colors
- Land color
- State borders
- Border color
- Border width
- Border opacity
So you can customize your election map to match the visual style of your YouTube channel, Instagram account, TikTok videos, or other content.
10. Customize state labels
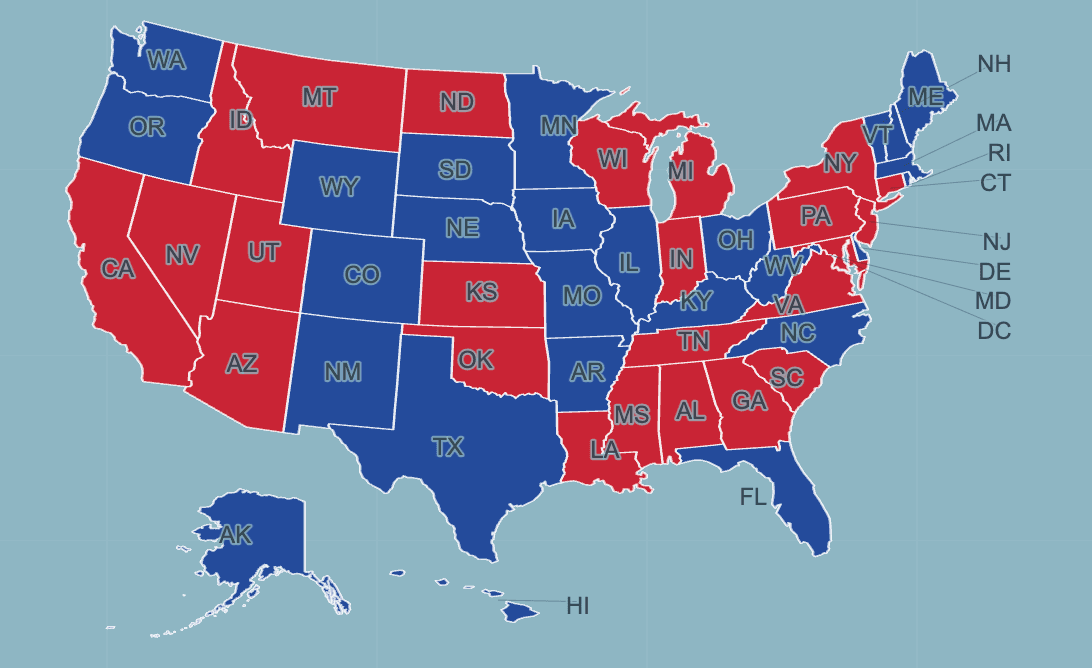
In the State Labels editing panel, you can choose how state names appear on your electoral map.
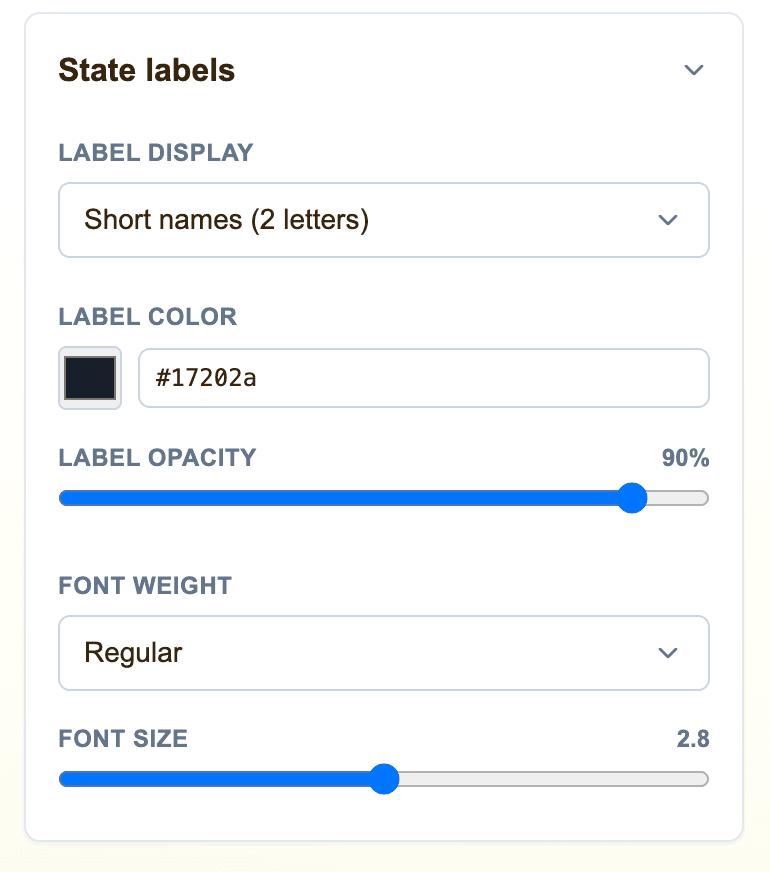
You can:
- Show two-letter state abbreviations such as CA, NV, NY, and so on
- Show the full state names
- Hide state names completely
You can also customize:
- Label color
- Opacity
- Font weight
- Font size
11. Show Electoral College votes
You can also enable Electoral College vote numbers above the state labels.
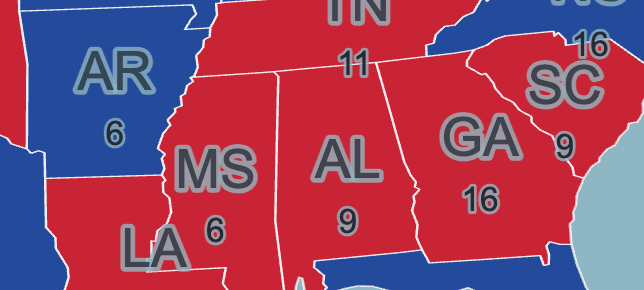
These numbers also have customizable settings, including:
- Text color
- Opacity
- Font weight
- Font size
12. Customize the election results bar and party colors
In the Election Bar settings, you can hide the bar completely or customize:
- Bar height
- Background color
- Text color
- Democratic colors
- Republican colors
- Colors for different winning margins
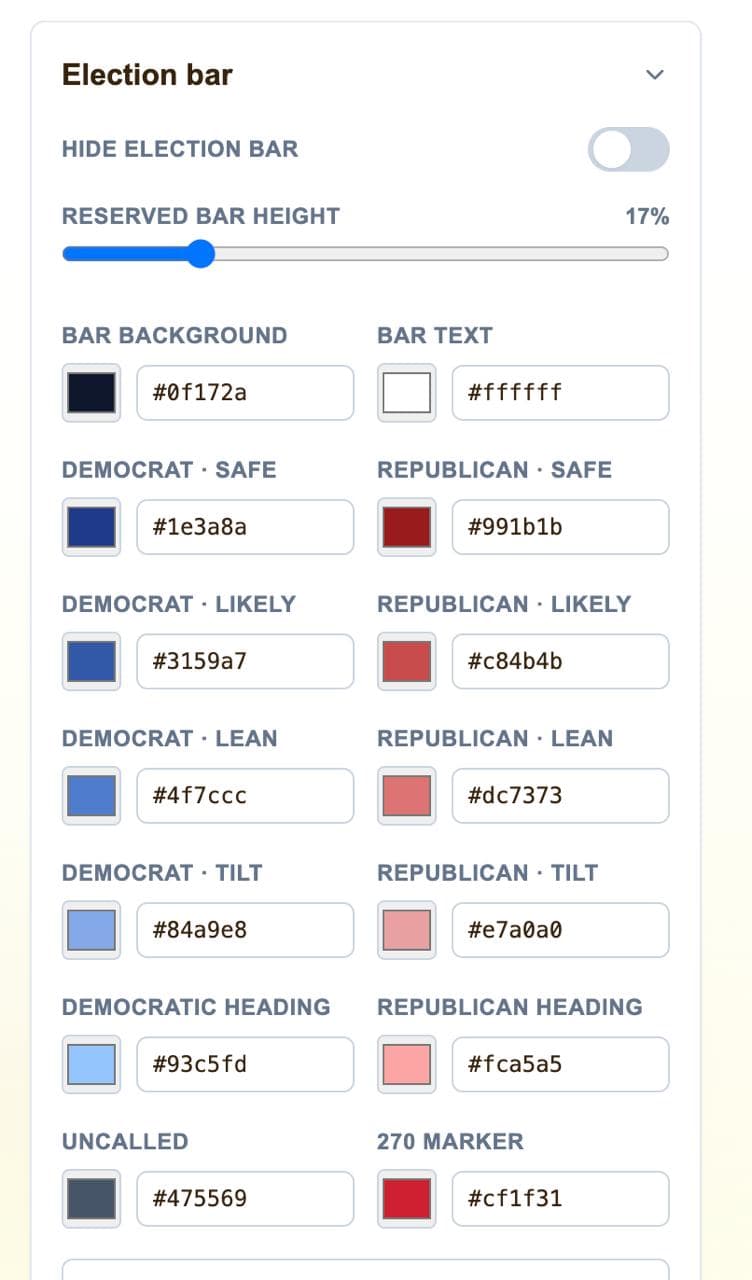
The winning-margin system works like this:
| Winning margin | Rating |
|---|---|
| Less than 5 points | Tilt |
| 5 to less than 10 points | Lean |
| 10 to less than 15 points | Likely |
| 15 points or more | Safe |
Examples when the two values total 100%:
- 51% vs. 49% → 2-point margin → Tilt
- 53% vs. 47% → 6-point margin → Lean
- 56% vs. 44% → 12-point margin → Likely
- 60% vs. 40% → 20-point margin → Safe
- 50% vs. 50% → Tie
- One or both percentages missing → Uncalled
The party with the higher percentage determines whether the state uses a Democratic or Republican color.
Exactly 5 points is Lean, exactly 10 points is Likely, and exactly 15 points is Safe.
This allows you to create the familiar red-and-blue US election map style while still customizing the colors for your own content.
13. Name your map
After you finish customizing your map, give your project a name using the Title field at the top of the page.
14. Save your project
Click the Save button.
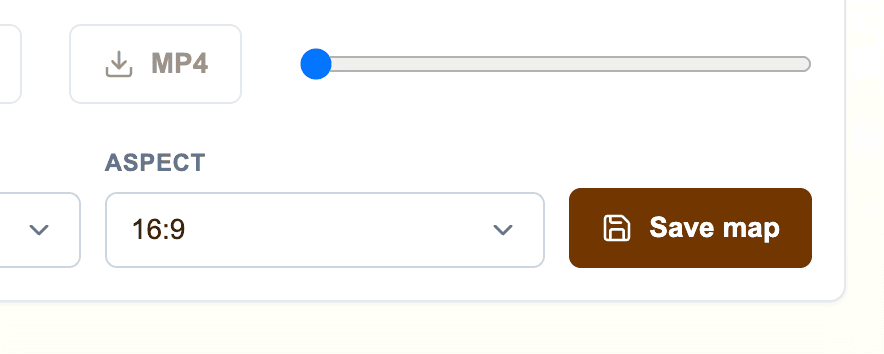
15. Export your animated election map
Click MP4 above the Save button to export your election map as a video.
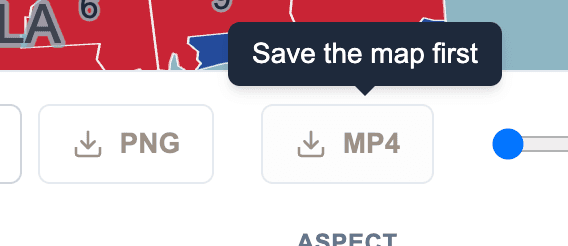
Now you have a customized animated US election map that you can use on social media.
If you have a paid subscription plan, the exported video is without watermarks and you can use it in your own social network accounts
We would appreciate it if you mentioned somewhere that you created your map using GenerateAnimatedMap.com.
An animated alternative to 270toWin and YAPms
GenerateAnimatedMap.com can be used as an alternative to 270toWin for election videos or an alternative to YAPms for animated election maps.
The main difference is animation.
Instead of creating only a static or interactive electoral map and then recording your screen, you can create an actual MP4 video with smooth state-coloring animations for your content.
You can customize your map, markers, objects, states, borders, labels, colors, and, of course, animations.
This makes it especially useful for YouTubers, political bloggers, journalists, TikTok creators, Instagram creators, and anyone who wants to visualize US presidential election predictions or results.
F.A.Q.
Why not just use AI to create the map by prompting something like “Make me an election map” or “Create a US election map showing Democrats vs. Republicans”?
AI image generators will usually give you a generic static image.
With GenerateAnimatedMap.com, you can create a customizable animated election map with different animation types, map styles, state colors, labels, and Electoral College vote numbers in seconds.
Can I create an election prediction map?
Yes. You decide which data will be displayed on the map.
You can create an election prediction map, visualize election results, or build a completely custom map animation.
GenerateAnimatedMap.com also allows you to use other types of animations, including object appearances or objects moving along routes that you draw manually.
Can I create a custom electoral map as both an image and an MP4 file?
Yes. You can export your custom electoral map as a short MP4 animation or as a PNG image.
Is GenerateAnimatedMap.com an AI animated election map generator?
Not yet.
We're currently working on our own MCP integration that will allow you to create and customize maps using natural-language prompts.
Updates are coming soon.
Thanks a lot for reading!
Subscribe to my LinkedIn account: https://www.linkedin.com/in/kamil-ocean/